The BIB trading interface contains a robust set of tools and options to help you in your trading analysis. These include:
* Candlestick charts
* Depth charts
* Time intervals
* Drawing tools
* Technical indicators
TradingView allows users to create a customized toolset for technical analysis. Let’s see how to use it on BIB.
Opening TradingView
The TradingView and trading tools are accessible in both the Classic and Advanced versions of our UI. These two views offer different, editable UI layouts and are switchable at any time.
- Click [TradingView] above the chart to gain full access to the trading tools available and candlestick charts.
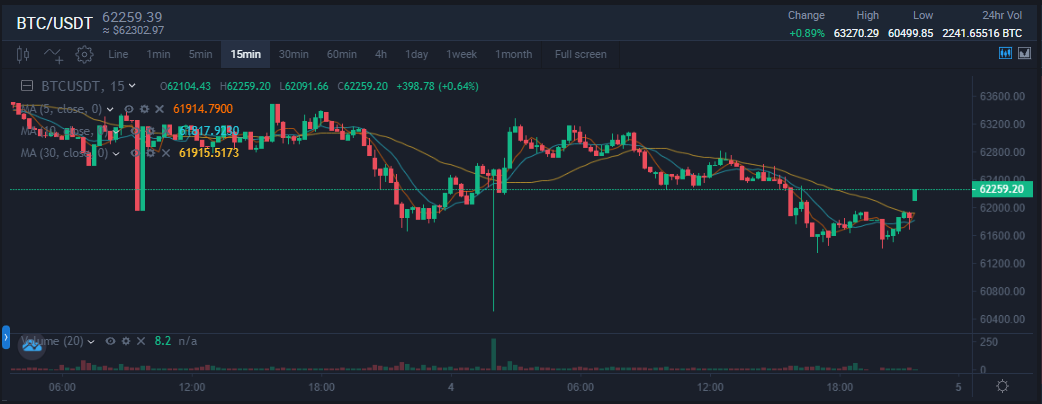
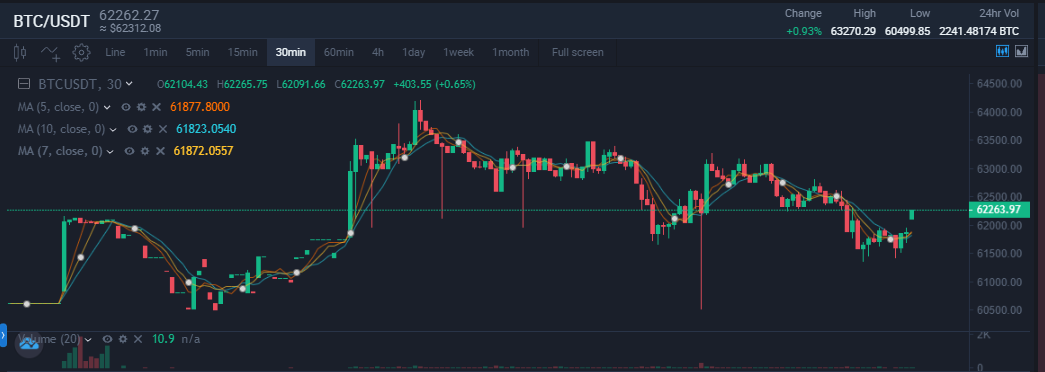
You will note that moving averages are already displayed on the chart. You can access their settings by clicking the [Settings] icon in the red square shown below. Each moving average is adjusted according to the specified time frame. For example, MA(7) is the moving average over seven candles of your time interval (e..g, 7 hours if you are using a 1H chart or 7 days if it’s a 1D chart).
- MA(7) - Purple
- MA(25) - Red
- MA(99) - Cyan
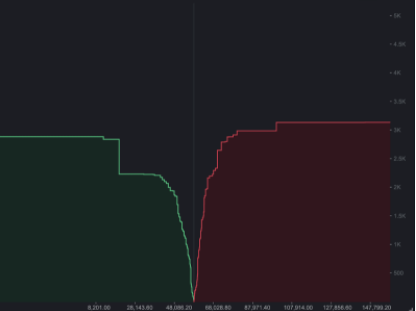
[Depth] provides a visual representation of unfilled buy/sell orders on the order book.
Candlestick Charts
Candlestick charts are a graphical representation of the price movements of an asset. The timeframe of each candlestick is customizable and can represent a given period. Each candlestick contains the open price/close price/high price/low price, along with the highest and lowest prices in the period. To customize your candlestick chart, double click on any of the candles in [TradingView] to bring up its settings.
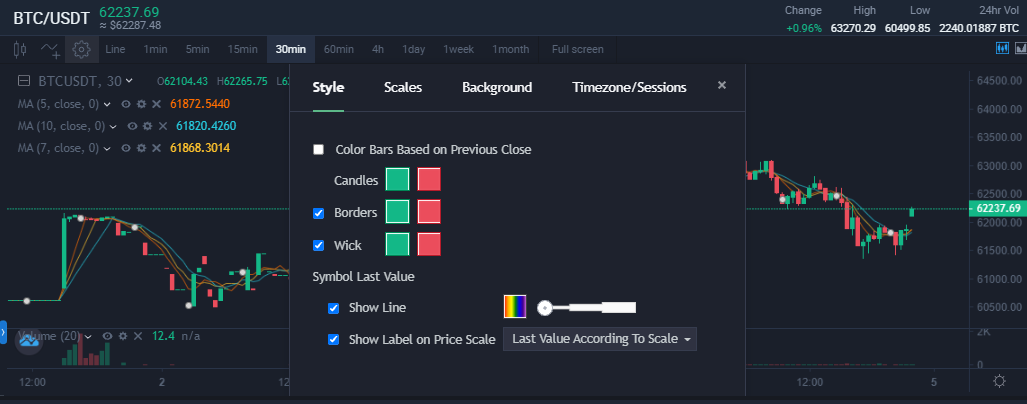
- [Style] allows you to change the way your candlesticks look.
- [Scales] gives numerous options for the scaling and margin of your candlesticks, including Auto Scale, Log Scale, and Percentage Scale.
- [Background] provides options for changing the look of the candlestick chart’s background.
- [Timezone/Sessions] allows you to choose your timezone.
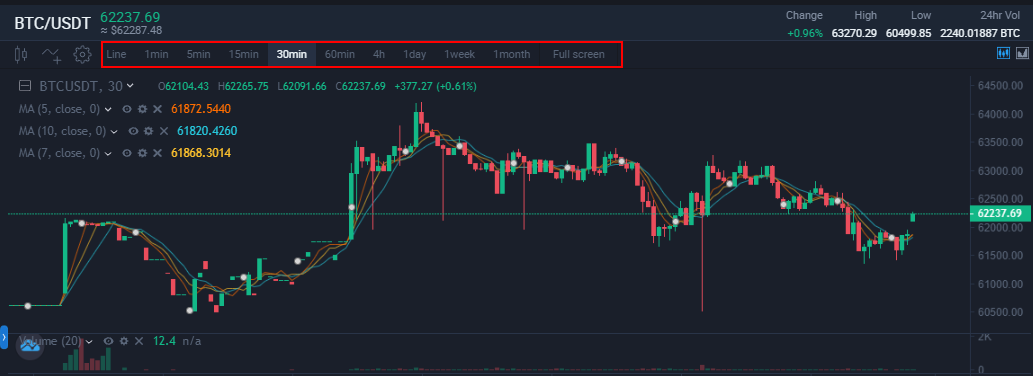
Candlestick Intervals
Here you can select a new interval or press the [Edit] button to add more intervals to your default options.
Drawing tools
The left-hand side of the chart provides several drawing tools and options to help with your charting analysis. You can also right-click each tool to find variations of the tool’s primary function. The default selection contains the following tools:
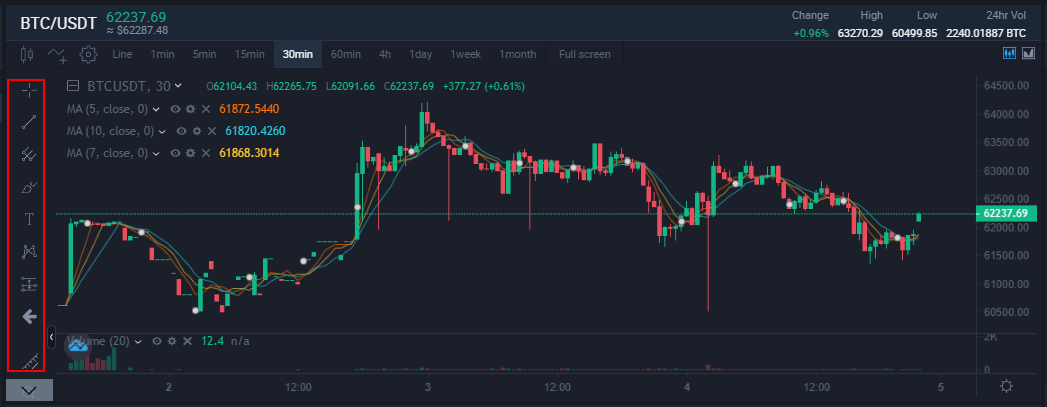
Popular Basic Tools
Long/Short Position
1.The long or short position tool allows you to track or simulate a trading position. You can manually adjust the Entry Price, Take Profit, and Stop-Loss levels. You will then see the corresponding risk/reward ratio. Select either the [Long Position] or [Short Position] tool.
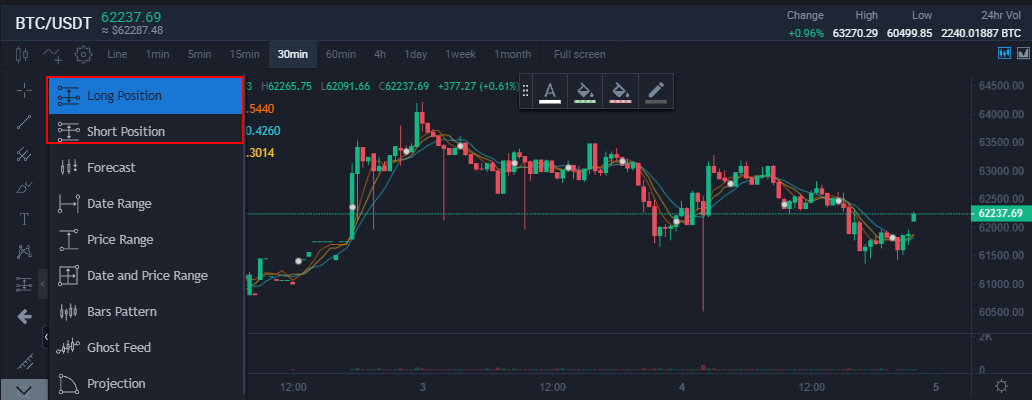
2. Click on the graph to create your long/short position. The green shaded area represents your target (potential profit), whereas the red shows your stop-loss area (potential loss). At the center, you can see the risk/reward ratio.
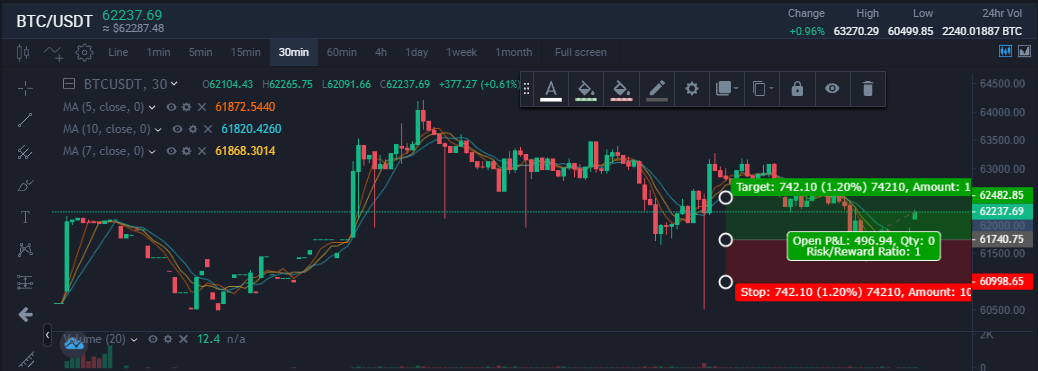
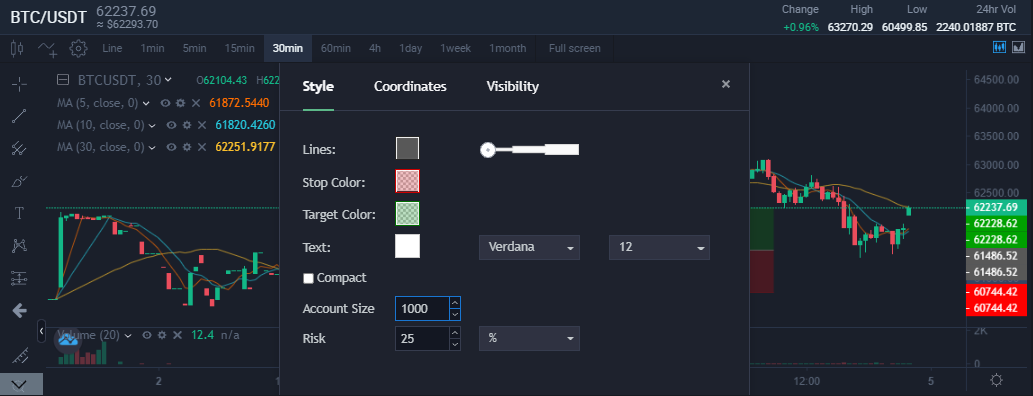
3. Drag the borders of the box to change your Risk/Reward Ratio. Target shows the difference in price between your Entry Price and the Take Profit level. Stop shows the price difference between your entry price and Stop-Loss level. Double click the Long Position/Short Position chart to adjust its settings. You can change the investment amount under [Account Size] along with your percentage risk. [Coordinates] allows you to change your Take Profit, Entry Price, and Stop Level numerically, while [Visibility] offers graphical customization.
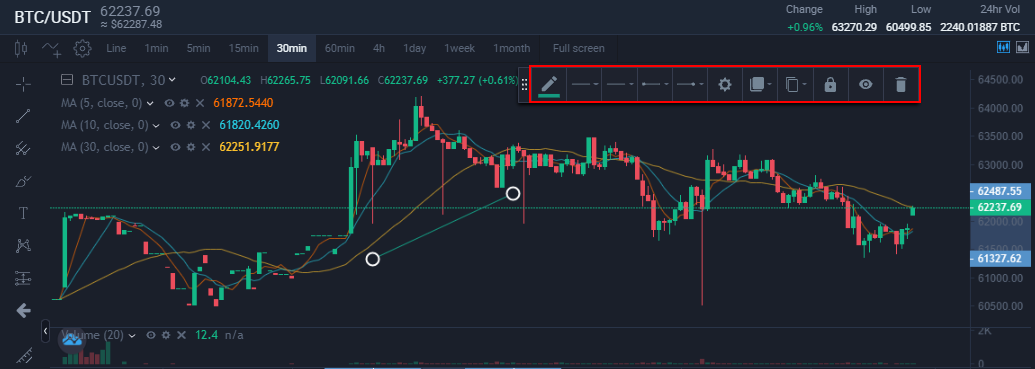
Trend Line
You can easily add trend lines to your chart to fit your technical analysis methods. To create trend lines, simply click the [Trend Line] tool and select the beginning and endpoints for your trend line. Below is an example of a simple trendline demonstrating possible market entry points. Thickness, color, and other features are customizable using the floating toolbox.
Technical Indicators
Technical indicators, such as Moving Average or Bollinger Bands, are addable in the TradingView. Click the [Technical Indicator] icon for a list of all available options.
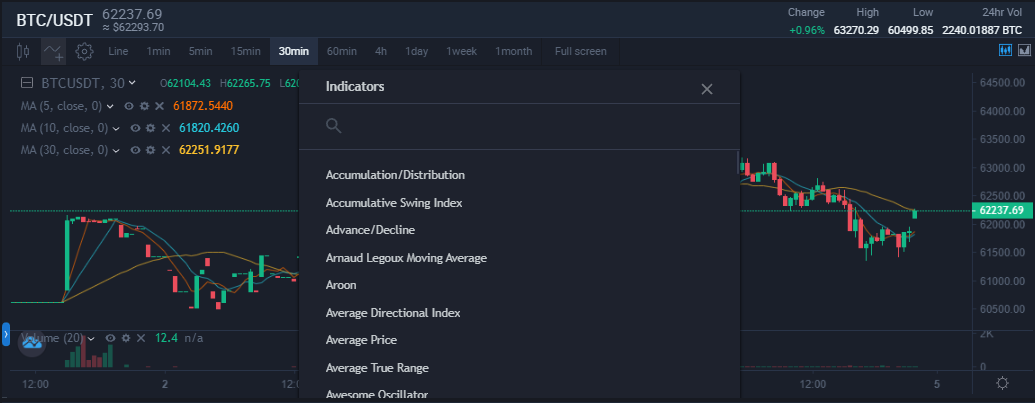
Once you have chosen a technical indicator, it becomes visible on the candlestick chart.
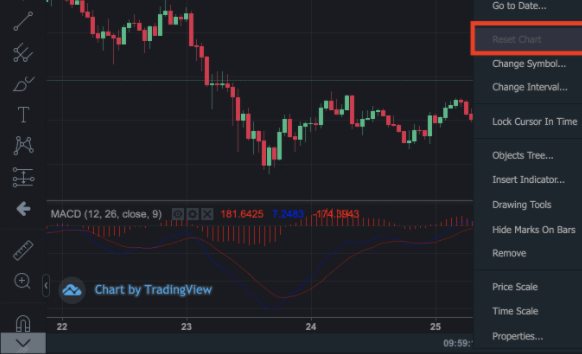
How to reset the chart
To remove the technical indicators, simply click on it to bring up the floating tool box, then click on the bin icon. If you want to reset the whole chart, right-click anywhere on the chart and click [Reset Chart], or press [Ctrl + R] on your keyboard.